- Khalid Alaoui, iOS developer
- Analytics
Then I built the scoreboard
| field | value |
|---|---|
| role | Built it, runs it |
| stack | Node.js, Express, SQLite |
| covers | The iOS and Android apps, every live app |
| data | Live production, 30 days to 2 Oct 2026 |
1 Overview
A custom mobile analytics platform for the iOS and Android apps, built with Node.js, Express and SQLite. It tracks orders, revenue, the conversion funnel and checkout health for every live app.
The iOS and Android apps send events to an analytics server I wrote. The dashboard shows orders, revenue, conversion, the ordering funnel and checkout health for all 290 active apps, or for any single one, live.
Client names are anonymised in every capture on this page.
2 Results
| metric | value |
|---|---|
| ordered, last 30 days | $742k |
| ordered since the analytics went live | $1.40M |
| sessions that end in an order | 17.7% |
| crash-free sessions | 99.9% |
Fig. 1 is the real dashboard. Click the screenshot to zoom, or switch to Order Pulse.
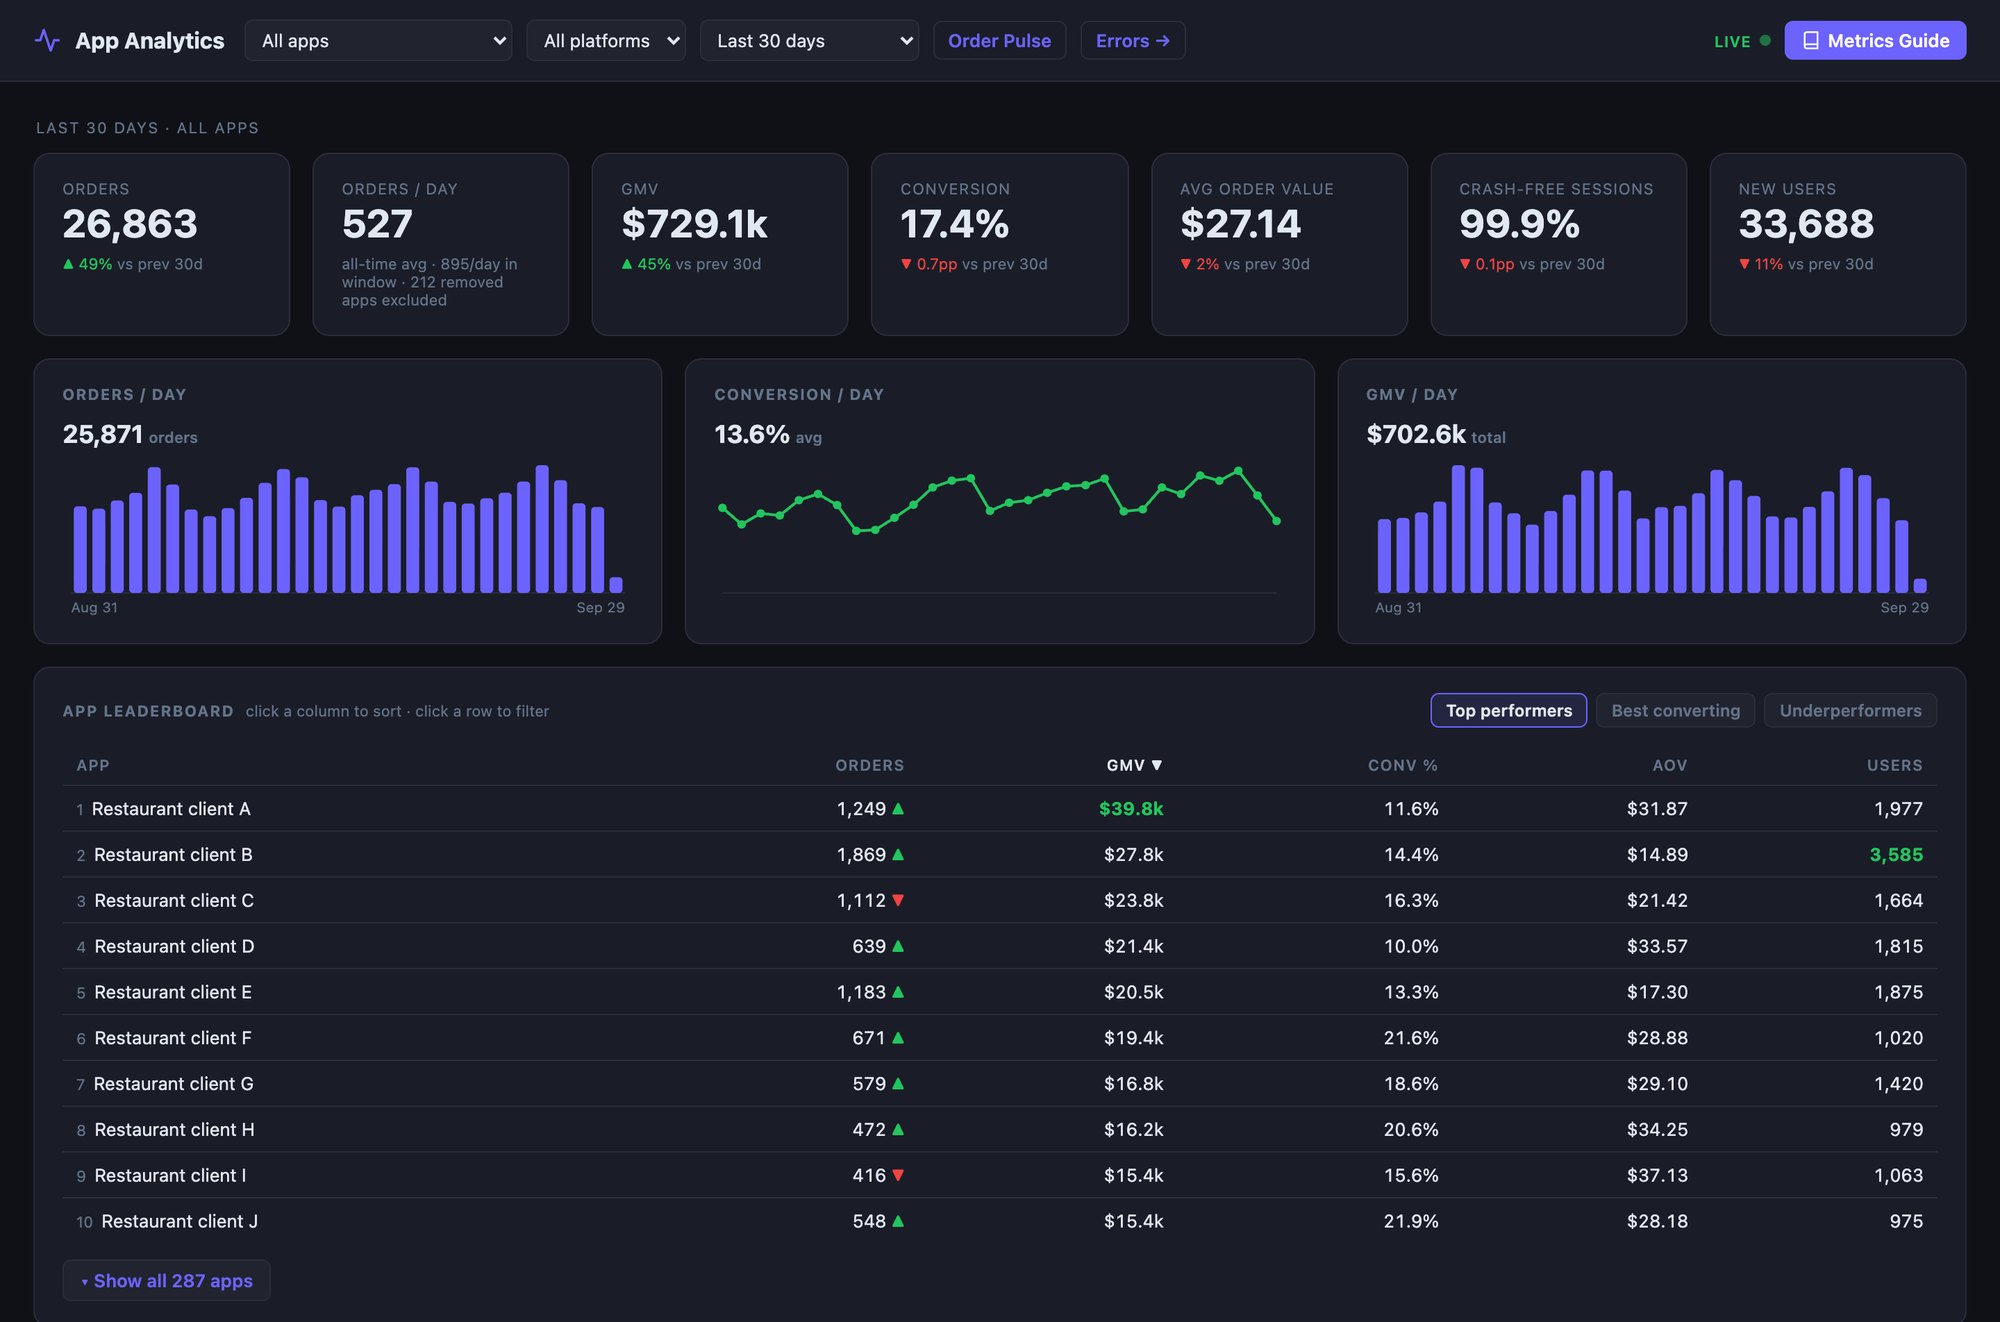
Live production data for the 30 days ending 2 October 2026. Client names are anonymised.
Figures are totals across all apps for the 30 days ending 2 October 2026.
3 How it's built
- Ingest. Express and SQLite take the events. Heavy aggregation runs in worker threads, so a multi-second
GROUP BYnever blocks incoming events. - Speed. A stale-while-revalidate cache and a priority queue keep the dashboard fast. Cold requests retry instead of hanging.
- Clean data. Apps removed from sale are excluded automatically, using the App Store Connect API cross-checked against
merchants.json.
The exclusion rule keeps unpublished apps from dragging the averages down.
4 Order Pulse
Order Pulse ranks every app by revenue and flags which ones are growing, declining or taking zero orders. It is the second tab in Fig. 1.
5 Contact
Need an iOS developer or a data dashboard? I take freelance projects and I'm open to a full-time role, remote or with relocation.